MICROSOFT - from $1 to $10 to $100 and to $1000?
MICROSOFT ROSE BY 602,668% SINCE THE PUBLIC OFFERING ON MARCH 13, 1986
Microsoft went public on March 13, 1986. Its initial public offering (IPO) was priced at $21 per share. The close of the first trading day was at $35.50.
Adjusted for the stock splits, MSFT rose from the intraday low of $0.0885 on March 13, 1986, to the peak of July 31, 2025, at $533,45. This is a rise of 602,668%. The chart is shown below with the logarithmic scale.
Microsoft closed above $1 on May 23, 1990. It closed above $10 on December 9, 1996. It closed above $100 on June 1, 2018. WILL IT REACH $1000?
For my technical analyses, I use the linear charts, shown on the next lower charts.

The chart above shows Microsoft from the initial public offering in March 1986 with a logarithmic scale.
MICROSOFT PEAKED IN THE MEGA RESISTANCE 560 TO 600 ON JULY 31, 2025
Based on my Fibonacci wave correlations of the uplegs and corrections from the low in 1986, I identified the major resistance range between 530 and 600. The range is shown on the chart below. Microsoft registered a peak on July 31, 2025, at 555.45. This is very close to the long-term resistance at 560.
Because of the importance of the resistance 560, I am closely watching the correction of the past nine trading to see if MSFT registered a major top on July 31.
The chart of the present correction is shown on the next lower chart.
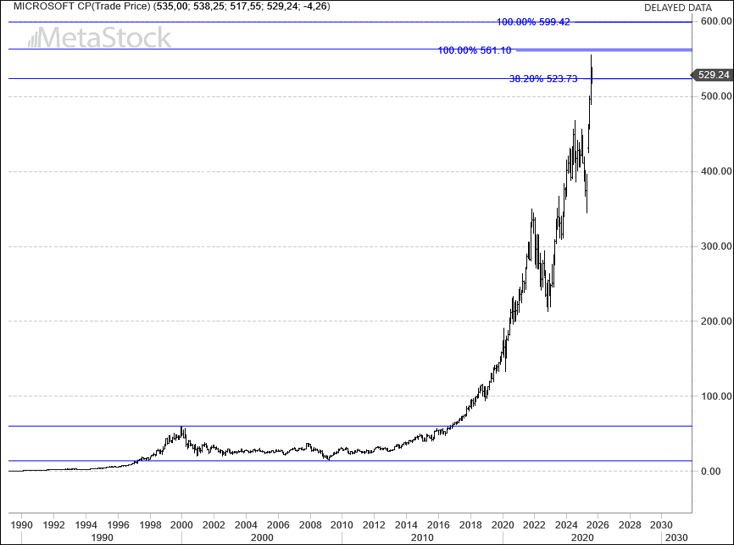
The chart above shows the bubble that has been building in Microsoft over the past three decades.
TAKE PROFITS AND SELL IF THE SUPPORTS AT 515, 505 AND 490 ARE BROKEN
On the chart below, I show you the presently unfolding correction. So far, the decline from the peak of July 31 appears as corrective a-b-c formation. This implies that probably, Microsoft could still rise to the upper resistance at 600.
HOWEVER, I WOULD TAKE PROFITS AND SELL IF THE SUPPORTS AT 515, 505 AND 490 ARE BROKEN.
Such breaks would indicate the Microsoft registered a top of at least medium-term if not even long-term degree.
However, if Microsoft breaks above the mega resistance range 560-600, then it could rise to 760 or 830.
SEE MY WEEKLY CHART OUTLOOK FOR FUTURE UPDATES ON MICROSOFT.
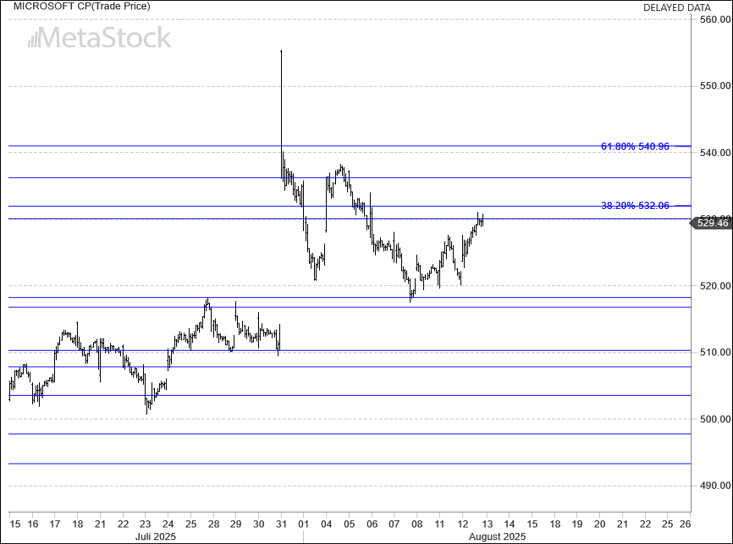
The chart above shows the correction that started on July 31, 2025, at 555.45.